
How to Calculate EBM kWh/kg, Unit Cost, and ROI in 2026
Factory buyers do not need another generic machine overview. They need a repeatable way to check whether an EBM project will improve operating margin after power, scrap, labor, and downtime are counted.
This page is built for that single task: calculate kWh/kg, convert it into unit cost, and estimate ROI payback using production-floor logic. If you are still comparing machine routes, review this extrusion blow molding machine guide first.

1) Collect the Minimum Inputs from Your Factory
Before any ROI claim, collect the same baseline inputs from both your current line and candidate line:
- Total electricity consumption (kWh) during stable production.
- Good bottle output weight (kg), excluding flash and scrap.
- Electricity tariff per kWh.
- Annual production volume (kg/year).
- Annual scrap cost, maintenance cost, and direct labor cost.
- Total project CapEx: machine, tooling, auxiliaries, logistics, installation, and training.
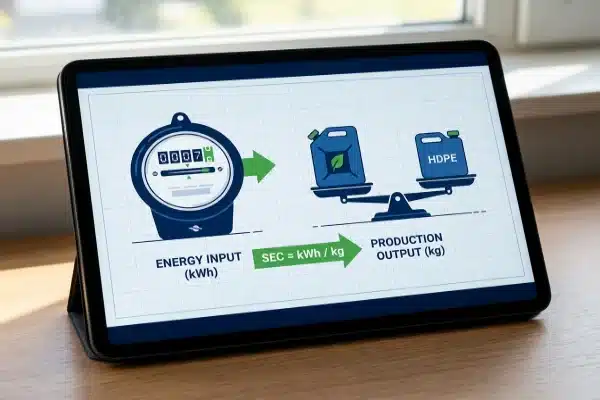
2) Calculate Real kWh/kg (SEC)
SEC (kWh/kg) = Total Energy Consumed (kWh) / Good Bottles Weight (kg)
Use at least one hour of stable production data. Count only saleable bottle mass in the denominator. If you include flash, SEC looks artificially low and the cost model becomes unreliable.

What to Include in Energy Input
- Main EBM machine load.
- Chiller load.
- Compressor load.
- Granulator load.
Ignoring auxiliaries can shift ROI calculations by roughly 20% to 30% in the original benchmark logic.
SEC Benchmark Bands (from the original article data)
| Machine Technology | Typical SEC (kWh/kg) | Energy Cost Impact | Cooling Load Requirement |
|---|---|---|---|
| Standard Hydraulic | 0.60-0.90 | High | High (Oil + Mold Cooling) |
| Hybrid (Inverter) | 0.40-0.55 | Medium | Medium |
| Full Electric (Servo) | 0.28-0.35 | Low | Low (Mold Cooling Only) |
3) Convert SEC into Unit Cost and Annual Savings
Energy Cost per kg = SEC × Electricity Tariff
Energy Cost per Bottle = Energy Cost per kg × Bottle Weight (kg)
Then compare old line vs. new line. In the original scenario logic, a savings of $0.05/kg at 500 tons/year equals $25,000/year in energy savings alone.
4) Build ROI Payback with Operating Logic
Payback Period (years) = Total CapEx / Annual Operating Savings
Total CapEx Scope
- Machine cost.
- Molds and die head tooling.
- Auxiliaries.
- Shipping, installation, and training.
Annual Savings Scope
- Energy savings (from SEC delta).
- Scrap reduction (better parison control, less waste).
- Maintenance reduction.
- Labor reduction (for example, deflashing/handling).
- Downtime reduction (including spare-part readiness).
Illustrative ROI Scenario (kept from original article)
| Cost Category | Old Hydraulic Machine | New Servo EBM Machine | Annual Savings |
|---|---|---|---|
| Energy Bill | $45,000 | $22,500 | $22,500 |
| Resin Waste (Scrap) | $12,000 (3% rate) | $2,000 (0.5% rate) | $10,000 |
| Maintenance | $5,000 | $1,000 | $4,000 |
| Labor (Deflashing) | $30,000 | $0 | $30,000 |
| Total Annual Gain | - | - | $66,500 |
With a machine price of $130,000 in that same scenario, payback is about 2 years.
5) Decision Check Before You Sign
- Use measured plant data, not nameplate power only.
- Exclude flash from good output weight.
- Include all auxiliaries in the SEC boundary.
- Validate downtime assumptions with spare-part planning.
- Compare your ROI model with guaranteed technical terms in the quote.
For broader selection criteria beyond this cost model, read how to choose an extrusion blow molding machine.
Related Internal Pages for the Same Decision Chain
- blow molding machine payback period and ROI
- servo vs hydraulic EBM real payback
- how to evaluate extrusion blow molding machine TCO for better profit, not just price
- extrusion blow molding machine technology trends
Need a Plant-Specific kWh/kg and ROI Check?
Send your bottle weight, annual volume, tariff, and current scrap rate. We will map a practical cost model for your project.