
Commissioning an Extrusion Blow Molding Machine to First Good Bottle
After machine arrival, the biggest startup risk is not installation itself, but the gap between power-on and first qualified bottle. This page is built for that exact stage: practical commissioning steps that help your team reach first good bottle quickly and hand over to production with confidence.
This is a focused commissioning page, not a general introduction to blow molding technology. If you need broader technical context, review our extrusion blow molding machine guide.
Scope of This Commissioning Guide
The goal is simple: move from installed equipment to first qualified bottle with fewer delays and fewer unstable trial cycles.
- Stage covered: machine in place, utilities available, mold and material ready.
- Main output: first good bottle criteria confirmed and repeatable.
- Handover target: stable baseline settings and operator-ready process.
Before Power-On: Readiness Checks That Prevent Delays
1) Utilities and safety interlocks
- Confirm electrical, air, cooling, and hydraulic connections are complete and stable.
- Verify emergency stop, door/interlock, and alarm logic before any production trial.
- Confirm mold area clearance and startup safety responsibilities by role.
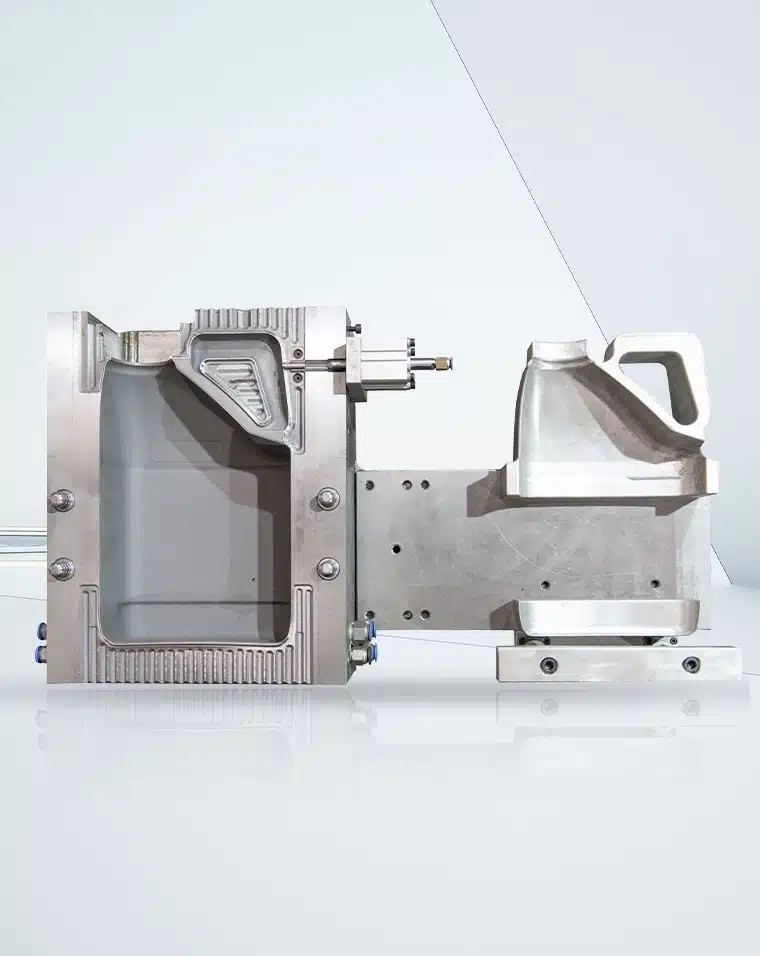
2) Mold installation and mechanical alignment
- Install mold and verify closing/opening movement without abnormal resistance.
- Check clamp alignment and core moving parts according to your mold structure.
- Confirm trimming and bottle release path are physically clear.
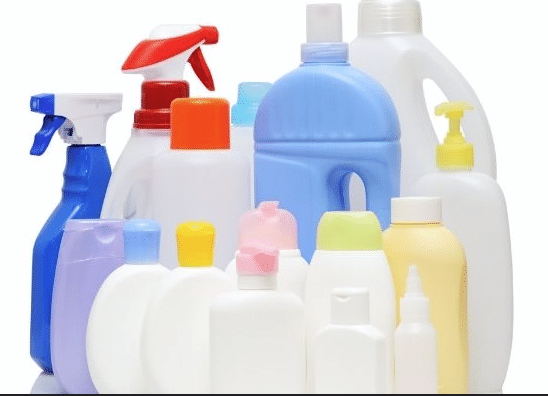
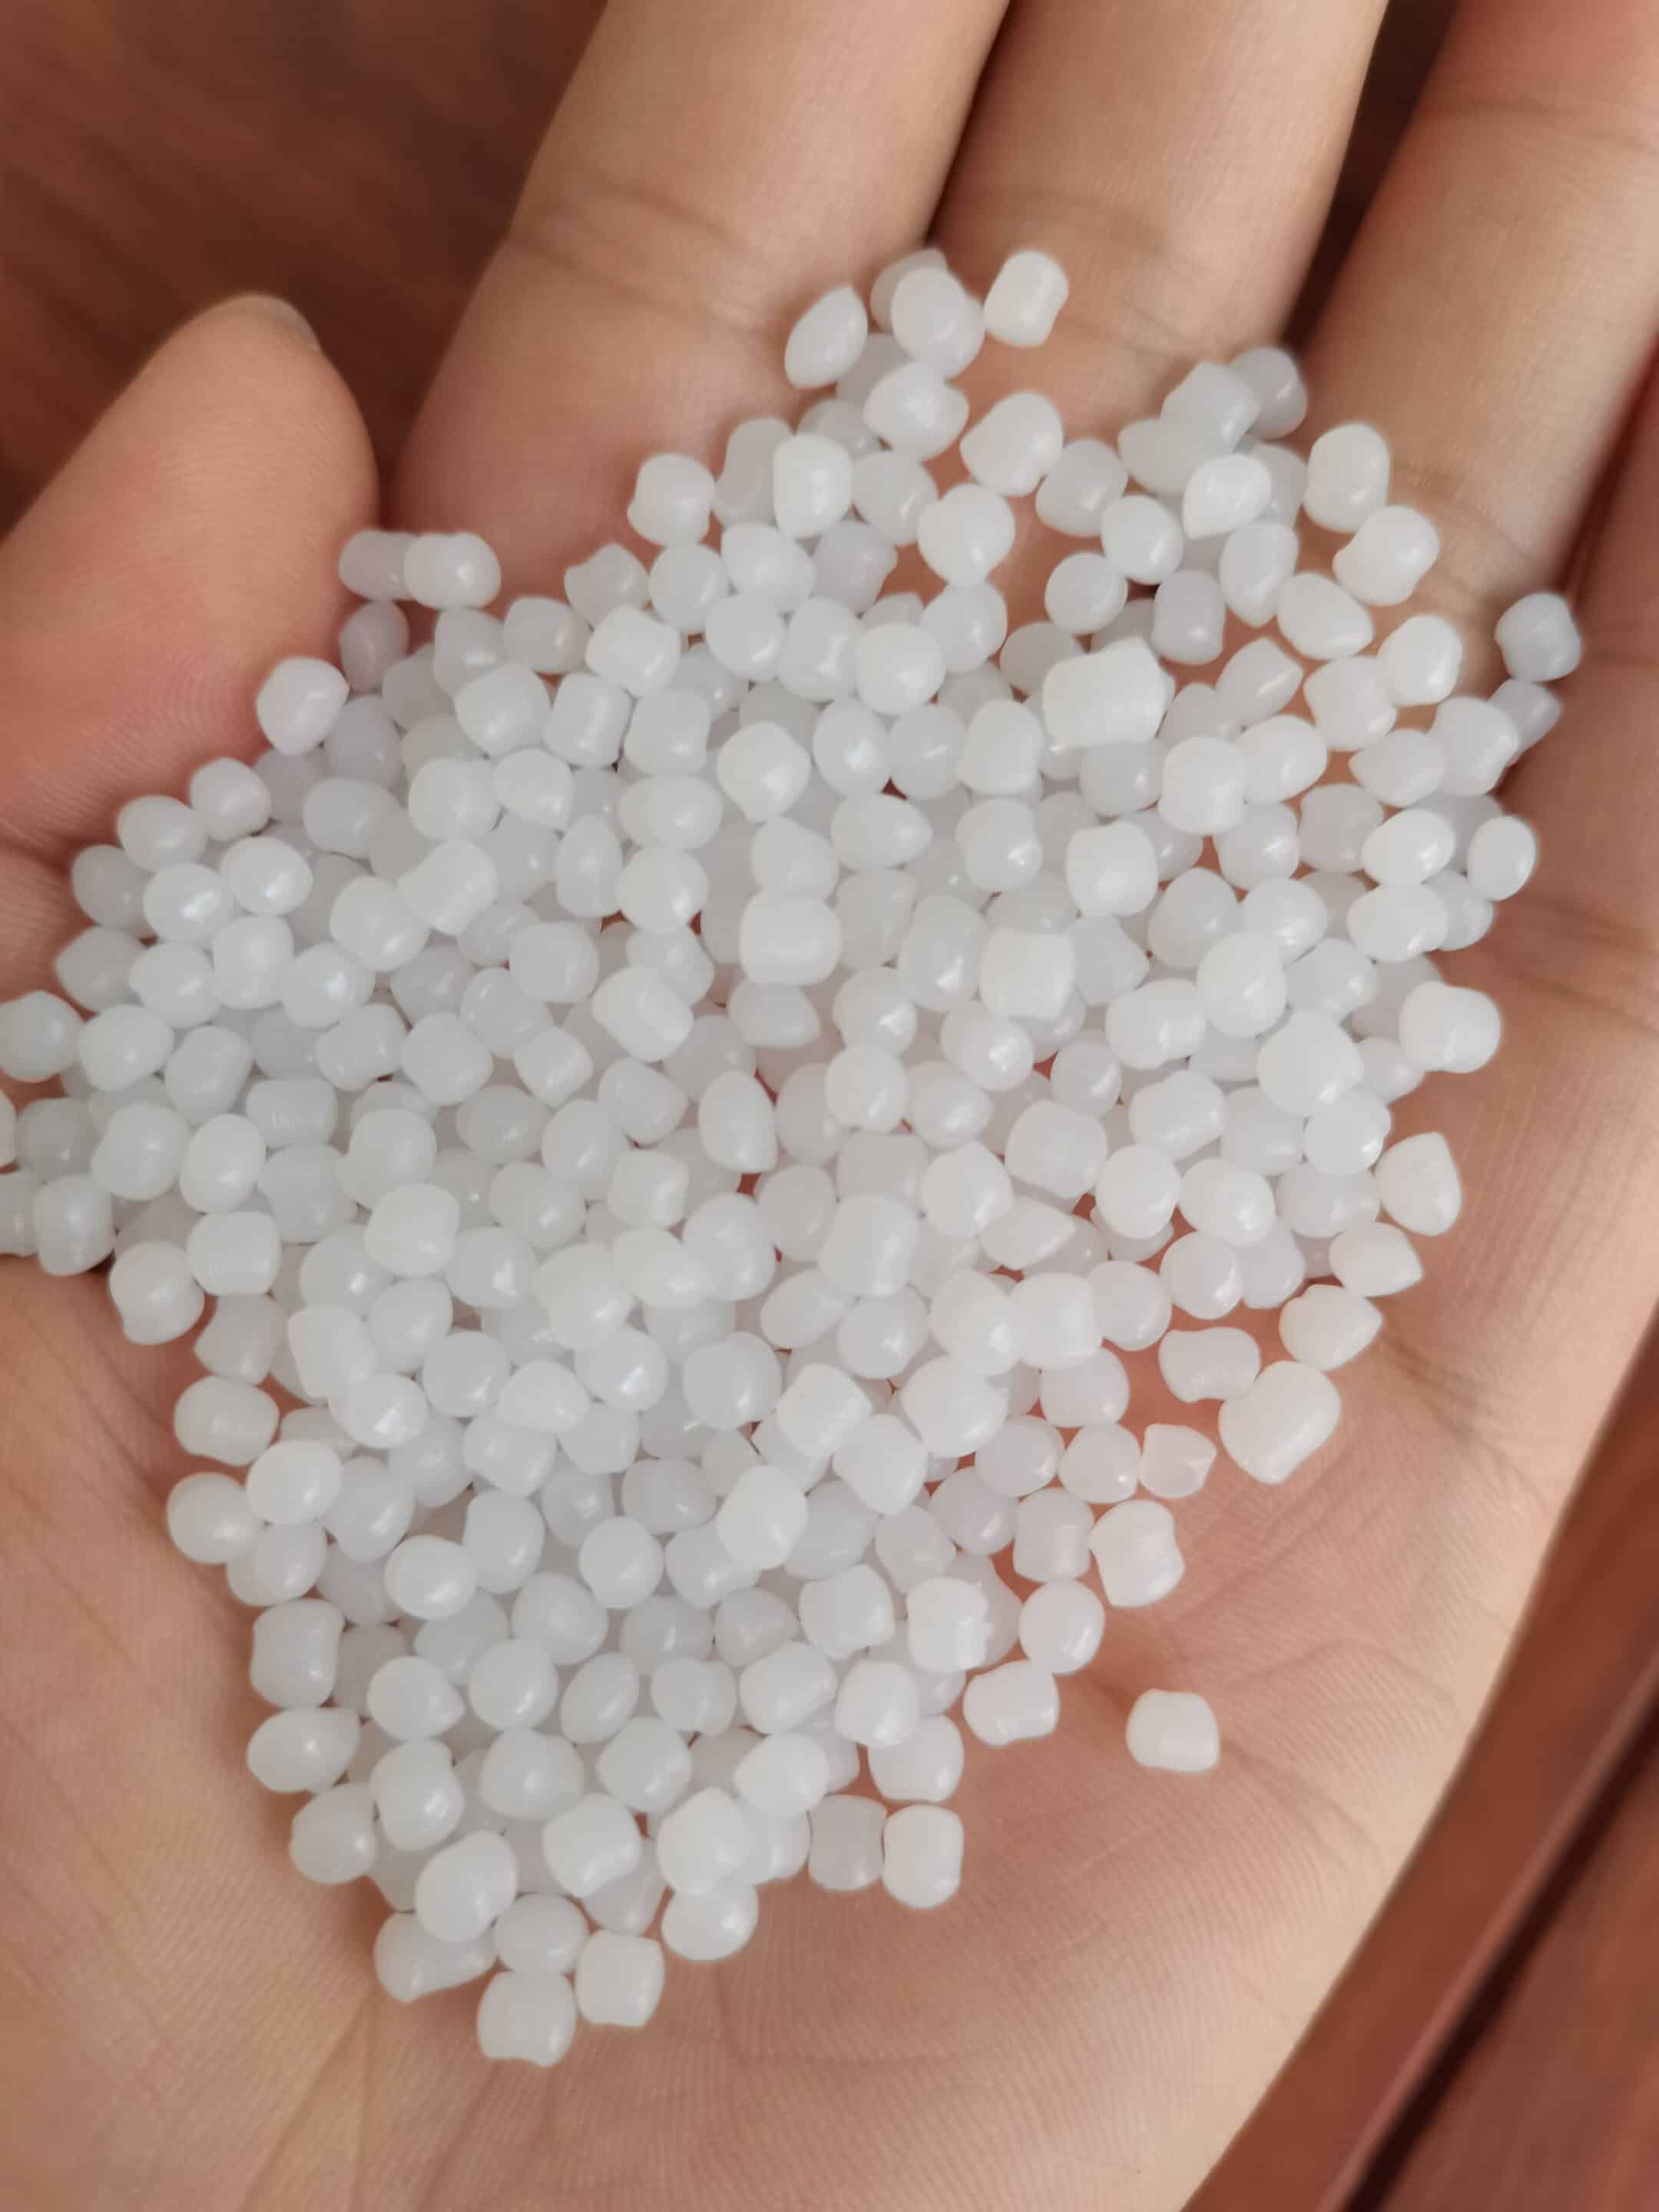
3) Material, bottle spec, and acceptance criteria
- Confirm the exact resin grade planned for startup batches.
- Align quality team and production team on the first good bottle pass criteria.
- Prepare a simple startup record sheet for parameter and defect tracking.
Step-by-Step Commissioning Workflow to First Good Bottle
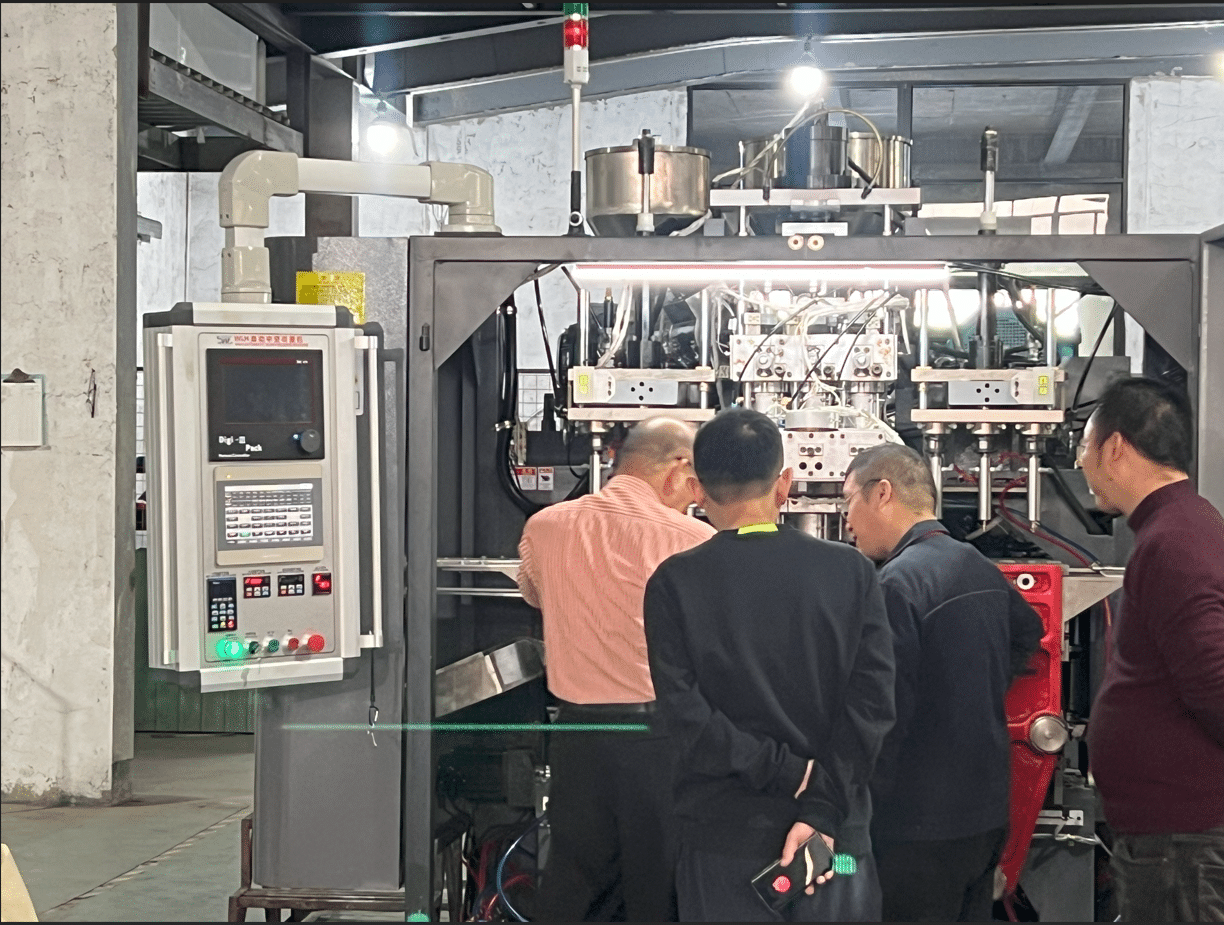
Step 1: System startup and dry cycle verification
Power on by standard sequence, warm up required zones, and run dry cycles first. Confirm sequence timing and actuator response before introducing material.
Step 2: Establish a conservative baseline recipe
Start from a stable baseline for your bottle family and resin type. Avoid aggressive tuning in early trials; use controlled, single-variable changes.
Step 3: Start first trial shots and inspect defects by category
Run short trial batches and classify defects (wall distribution, flash behavior, neck/finish issues, visual consistency). Keep each adjustment linked to one observed defect.

Step 4: Apply quick correction loops
Adjust in small steps, rerun, and compare against the same acceptance checklist. Do not change multiple unrelated settings at once.
Step 5: Confirm first good bottle with quality and production
When samples meet agreed criteria, complete joint sign-off by process, quality, and production leads.
Step 6: Lock baseline and define control limits
Record approved baseline settings and practical adjustment windows for shift teams.
Step 7: Handover with operator routine
Complete shift handover notes, startup checklist, and abnormal-response rules so output remains stable after commissioning support leaves.
First Good Bottle Acceptance Checklist
| Checkpoint | Sign-off requirement |
|---|---|
| Bottle appearance | No critical visual defects against agreed sample standard. |
| Wall consistency | Wall distribution is stable across repeated trial pieces. |
| Trim and release | Deflashing and bottle release are consistent without abnormal stops. |
| Process repeatability | Same baseline settings produce repeatable acceptable pieces. |
| Handover record | Baseline recipe, change log, and operator notes are documented. |
Common Commissioning Delays and Fast Corrections
| Delay pattern | Practical correction |
|---|---|
| Repeated trial cycles with unclear direction | Force one-variable-at-a-time adjustments with a defect-to-action log. |
| Quality and process teams use different standards | Lock first good bottle criteria before tuning begins. |
| Machine runs but output is unstable after handover | Document control limits and startup sequence for shift operators. |
| Frequent startup interruptions | Recheck utilities, interlocks, mold movement, and alarm root causes in sequence. |
After First Good Bottle: Stabilize for Production
- Freeze the approved startup recipe and define who can change parameters.
- Set a startup inspection routine for the first production period.
- Train operators on standard startup, correction boundaries, and escalation points.
For line-level planning beyond startup, review our extrusion blow molding machine solutions.
Related Internal Resources
- How to Operate an Extrusion Blow Moulding Machine
- Extrusion Blow Molding Machine Maintenance Checklist
- Extrusion Blow Molding Troubleshooting
- Blow Molding Production Line Layout
Need support to shorten your commissioning timeline to first good bottle?
Contact LEKA engineering support