

How to Calculate the Real Cost of a Blow Molding Machine (Free TCO Checklist)
Why a "Cheap" Machine Can Be Your Most Expensive Investment
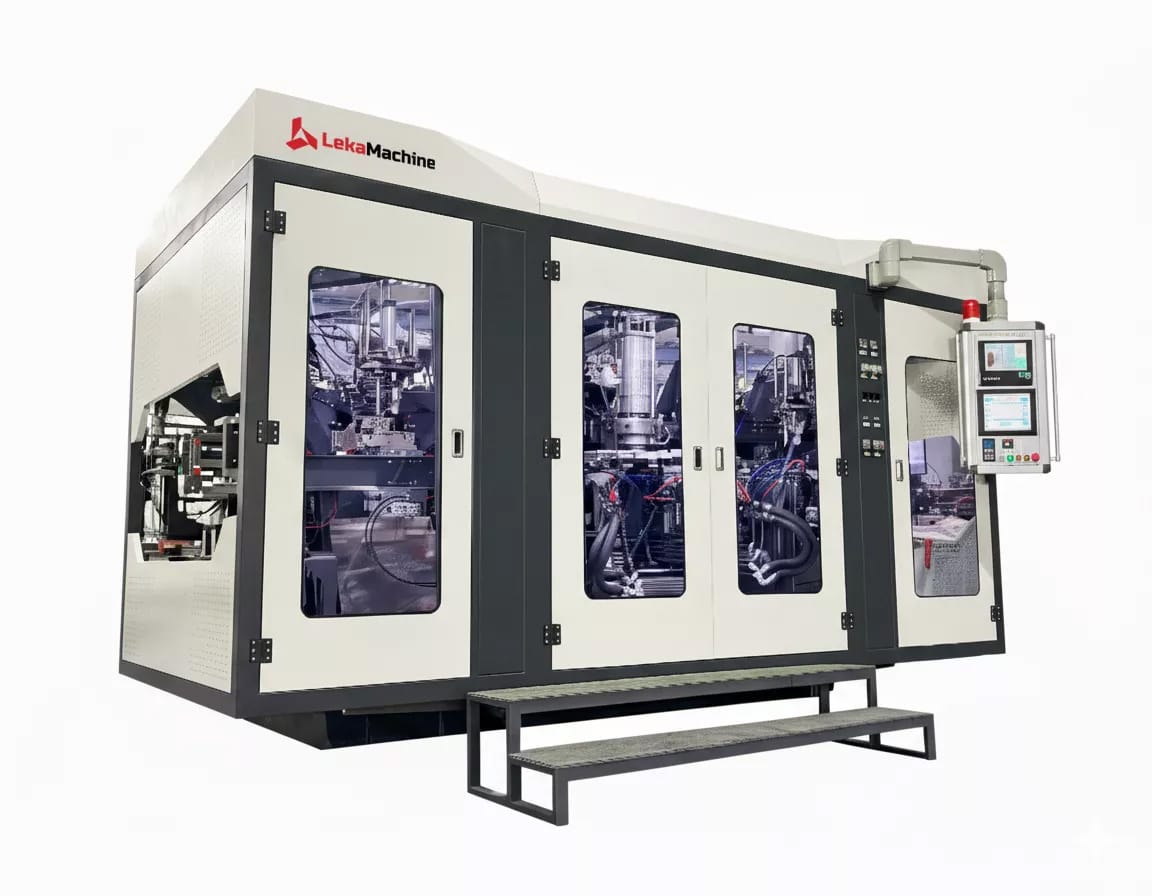
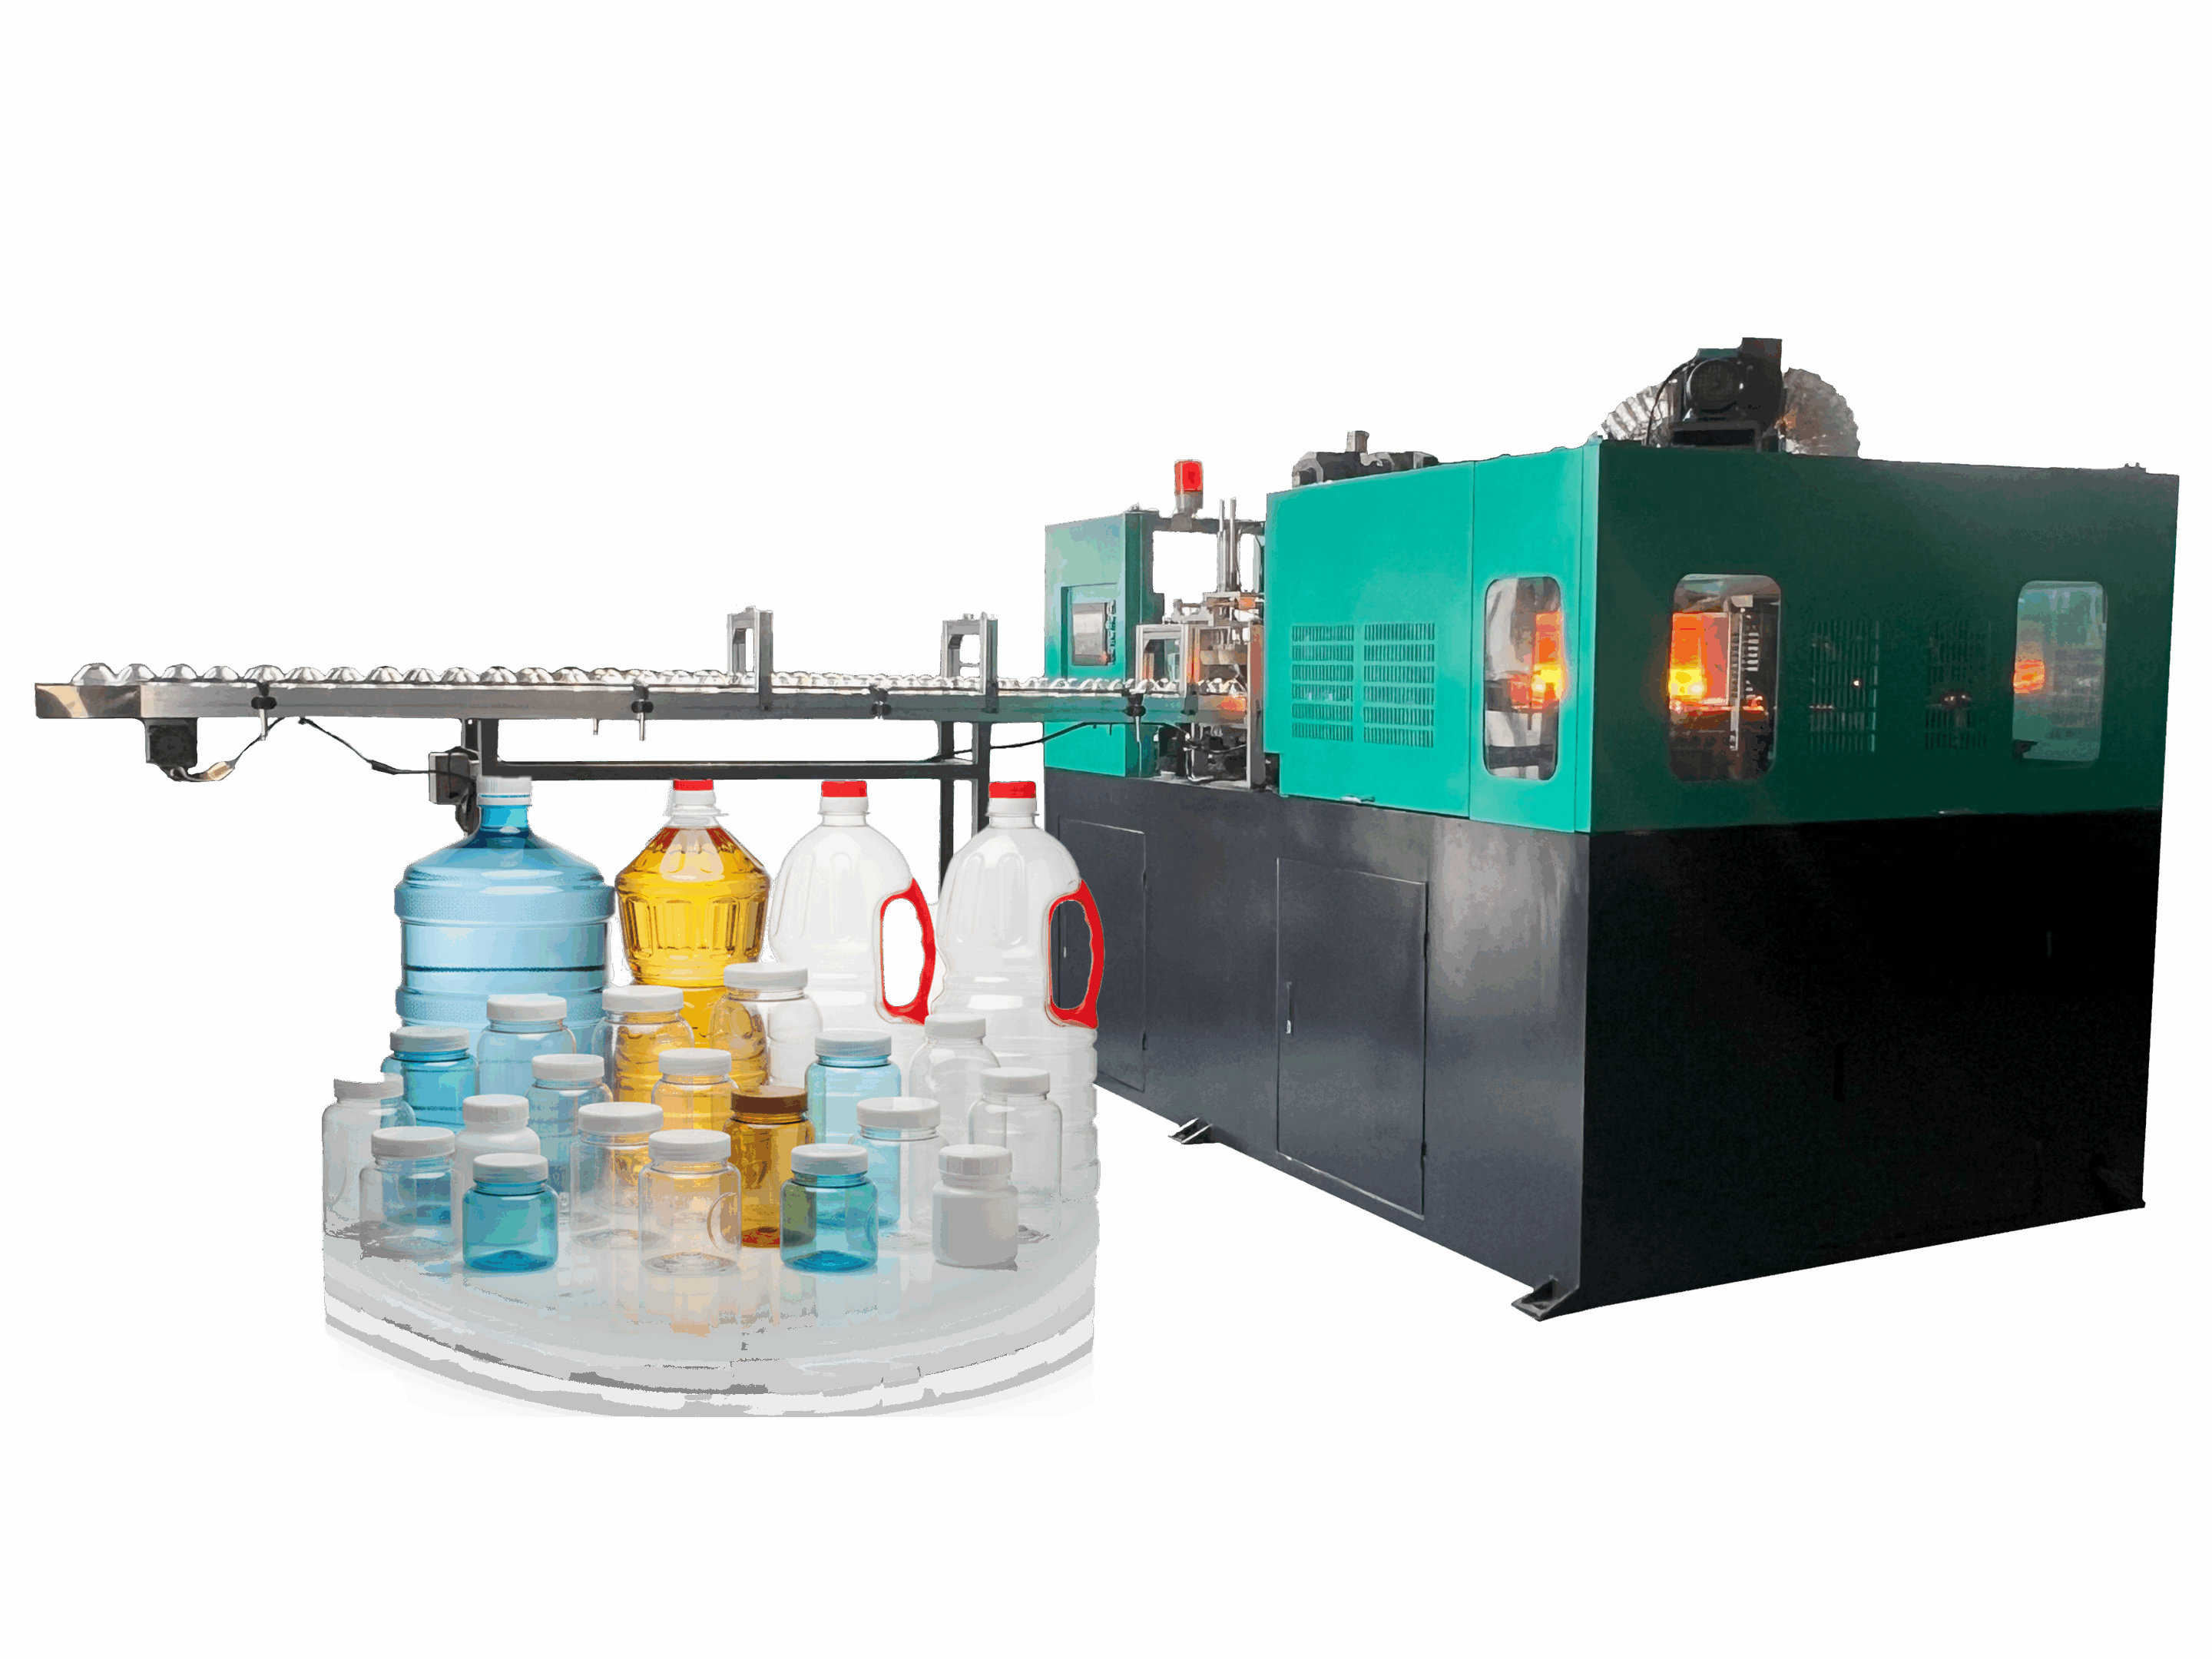
When you are ready to buy a new şişirme makinesi, you naturally want the best value. But in this industry, the "lowest price tag" is often a trap.
I have seen too many factories buy a "bargain" machine, only to pay for it over and over again for the next ten years.
The purchase price is just the entry fee. The number that actually matters to your profit margin is the Total Cost of Ownership (TCO).
Let’s break down the real math of a low-energy machine versus a "cheap" high-energy one.
Section 1: The High-Energy Trap
Many buyers stop looking after they see the initial quote. Let's look at why that is dangerous. Imagine you have two choices:
Machine A (The "Cheap" Option)
Purchase Price: $100,000
On paper, it saves you $80,000 immediately. But it's a hungry beast that eats electricity and maintenance hours.
Machine B (High-Efficiency)
Purchase Price: $180,000
Built with servo-systems and precision parts. It costs more upfront but stabilizes your long-term expenses.
Let's look at a 5-year comparison. This data accounts for seasonal energy spikes, real-world scrap rates, and maintenance labor.
| Cost Category (5 Years) | Machine A (Low Price) | Machine B (Efficient) | Difference |
|---|---|---|---|
| Initial Price | $100,000 | $180,000 | +$80,000 |
| Total Energy Cost | High Consumption | Optimized (Servo) | Machine B saves significantly |
| Total Maintenance | Frequent breakdowns | Scheduled only | Machine B saves significantly |
| Total Output | 29.3 Million Bottles | 35.8 Million Bottles | +6.5 Million Bottles |
| Toplam 5 Yıllık Maliyet | $1,078,981 | $949,445 | Machine A costs $129,536 MORE |
The "Crossover" Point: Where You Start Losing Money
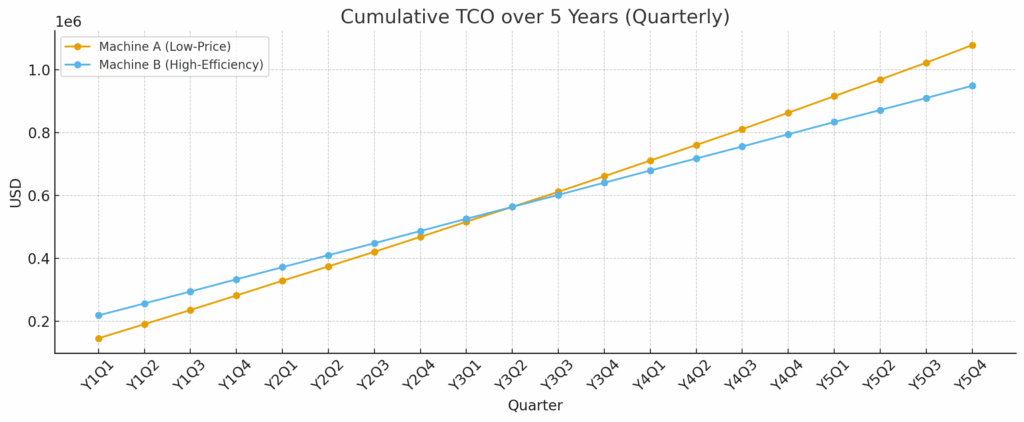
Around Year 3, the "cheap" machine (Orange) becomes more expensive than the efficient machine (Blue).
If you look at the cost curves, something scary happens around Year 3.
The "cheap" orange line (Machine A) crosses over the blue line (Machine B). At that exact moment, your initial $80,000 savings are gone—burned up by electricity bills and spare parts. From that day forward, you are technically losing money every time you turn the machine on.
Section 2: Why Does This Happen? (The Hidden Killers)
Why is the difference so big? It comes down to two things: Downtime ve Friction.
1. The Downtime Spiral

Cheap machines don't just break; they age poorly.
In Year 1, Machine A works okay. By Year 3, components start failing. Downtime spirals out of control. You are paying operators to stand around while mechanics fix the machine.
2. The Output Gap

Machine B consistently produces more bottles every single quarter.
Because of that downtime, Machine A produced 6.5 million fewer bottles over 5 years.
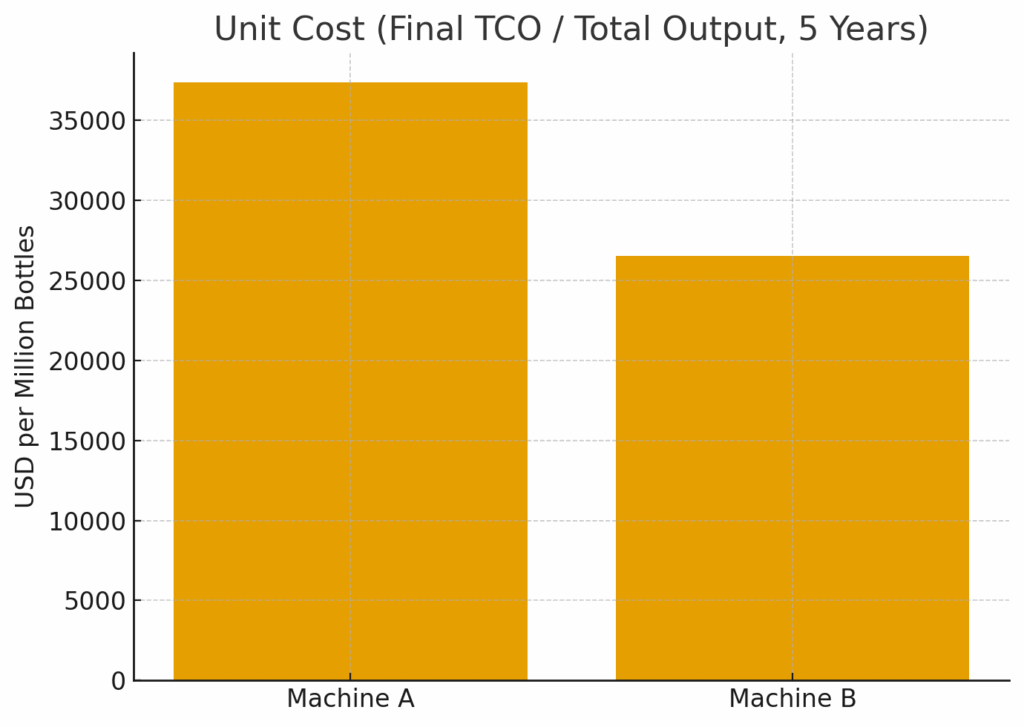
The Final Verdict: Cost Per Unit
Section 3: What Actually Makes a Machine Efficient?
Efficiency isn't just a marketing word. It comes from three specific engineering choices. When you are talking to a supplier, ask them about these three things:
1. The Configuration (The Heart)
Does the machine use an old-fashioned fixed pump, or a modern servo-motor system?
At LEKAmachine, we use servo-driven systems. This means the machine only uses power when it actually needs to move. It doesn't sit there humming and wasting electricity when it's idle. This alone can cut energy consumption drastically.
2. Assembly Precision (The Friction)
If a machine is assembled poorly, the parts "fight" each other. This creates internal friction. The motor has to work harder just to overcome that friction, which wastes power and generates heat.
Our Approach: We don't just rely on automated CNC. Our assembly team is built on veteran technicians. They use their hands-on experience to ensure every part fits "silky smooth," reducing wear and tear without driving up the price.
3. Lubrication Design
A machine that isn't lubricated correctly effectively grinds itself to death. We have innovated our hydraulic circuits and mechanical designs to ensure oil gets exactly where it is needed. We want our energy to go into clamping the mold and extruding plastic, not fighting resistance inside the pipes.
Conclusion: Look at the 10-Year Picture
A şişirme makinesi is a long-term asset, usually depreciated over 5 to 10 years.
Don't let a low "Day 1" price trap you into a decade of high energy bills and production bottlenecks. The most profitable factories are the ones that focus on TCO.
You need a machine that solves your bottlenecks, not a machine that becomes one.
Ready to calculate your own costs?
[Click Here to Download: Blow Molding Machine TCO Checklist.pdf]
If you are tired of high energy bills and unpredictable downtime, let’s discuss a çözüm that fits your production goals.
Explore our Machines:
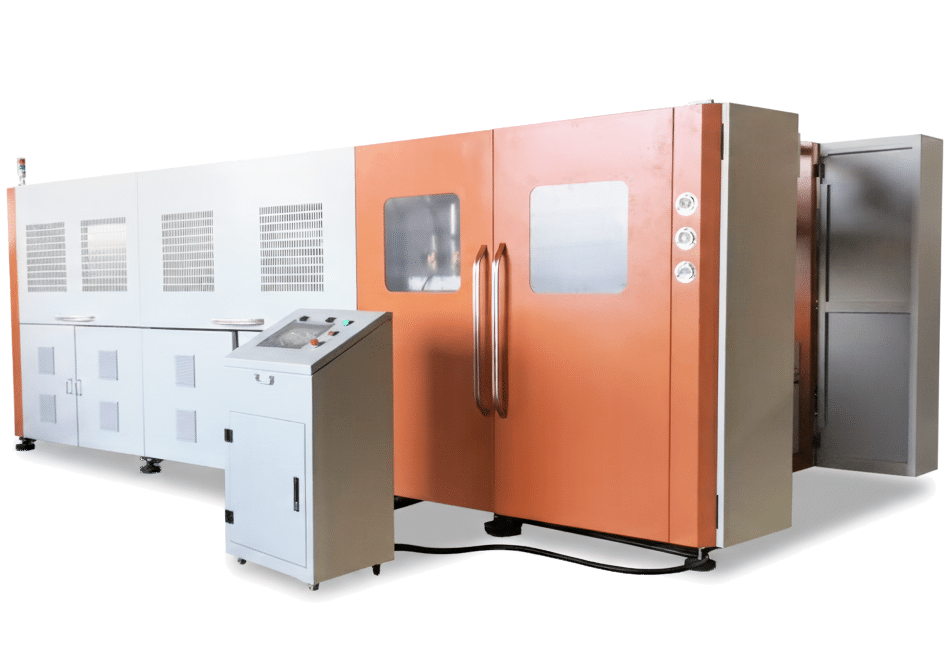
(Note: We specialize in Extrusion and Streç Şişirme. We do not offer injection şişirme kalıplama solutions.)<!-- [et_pb_line_break_holder] -->


0 Yorum