
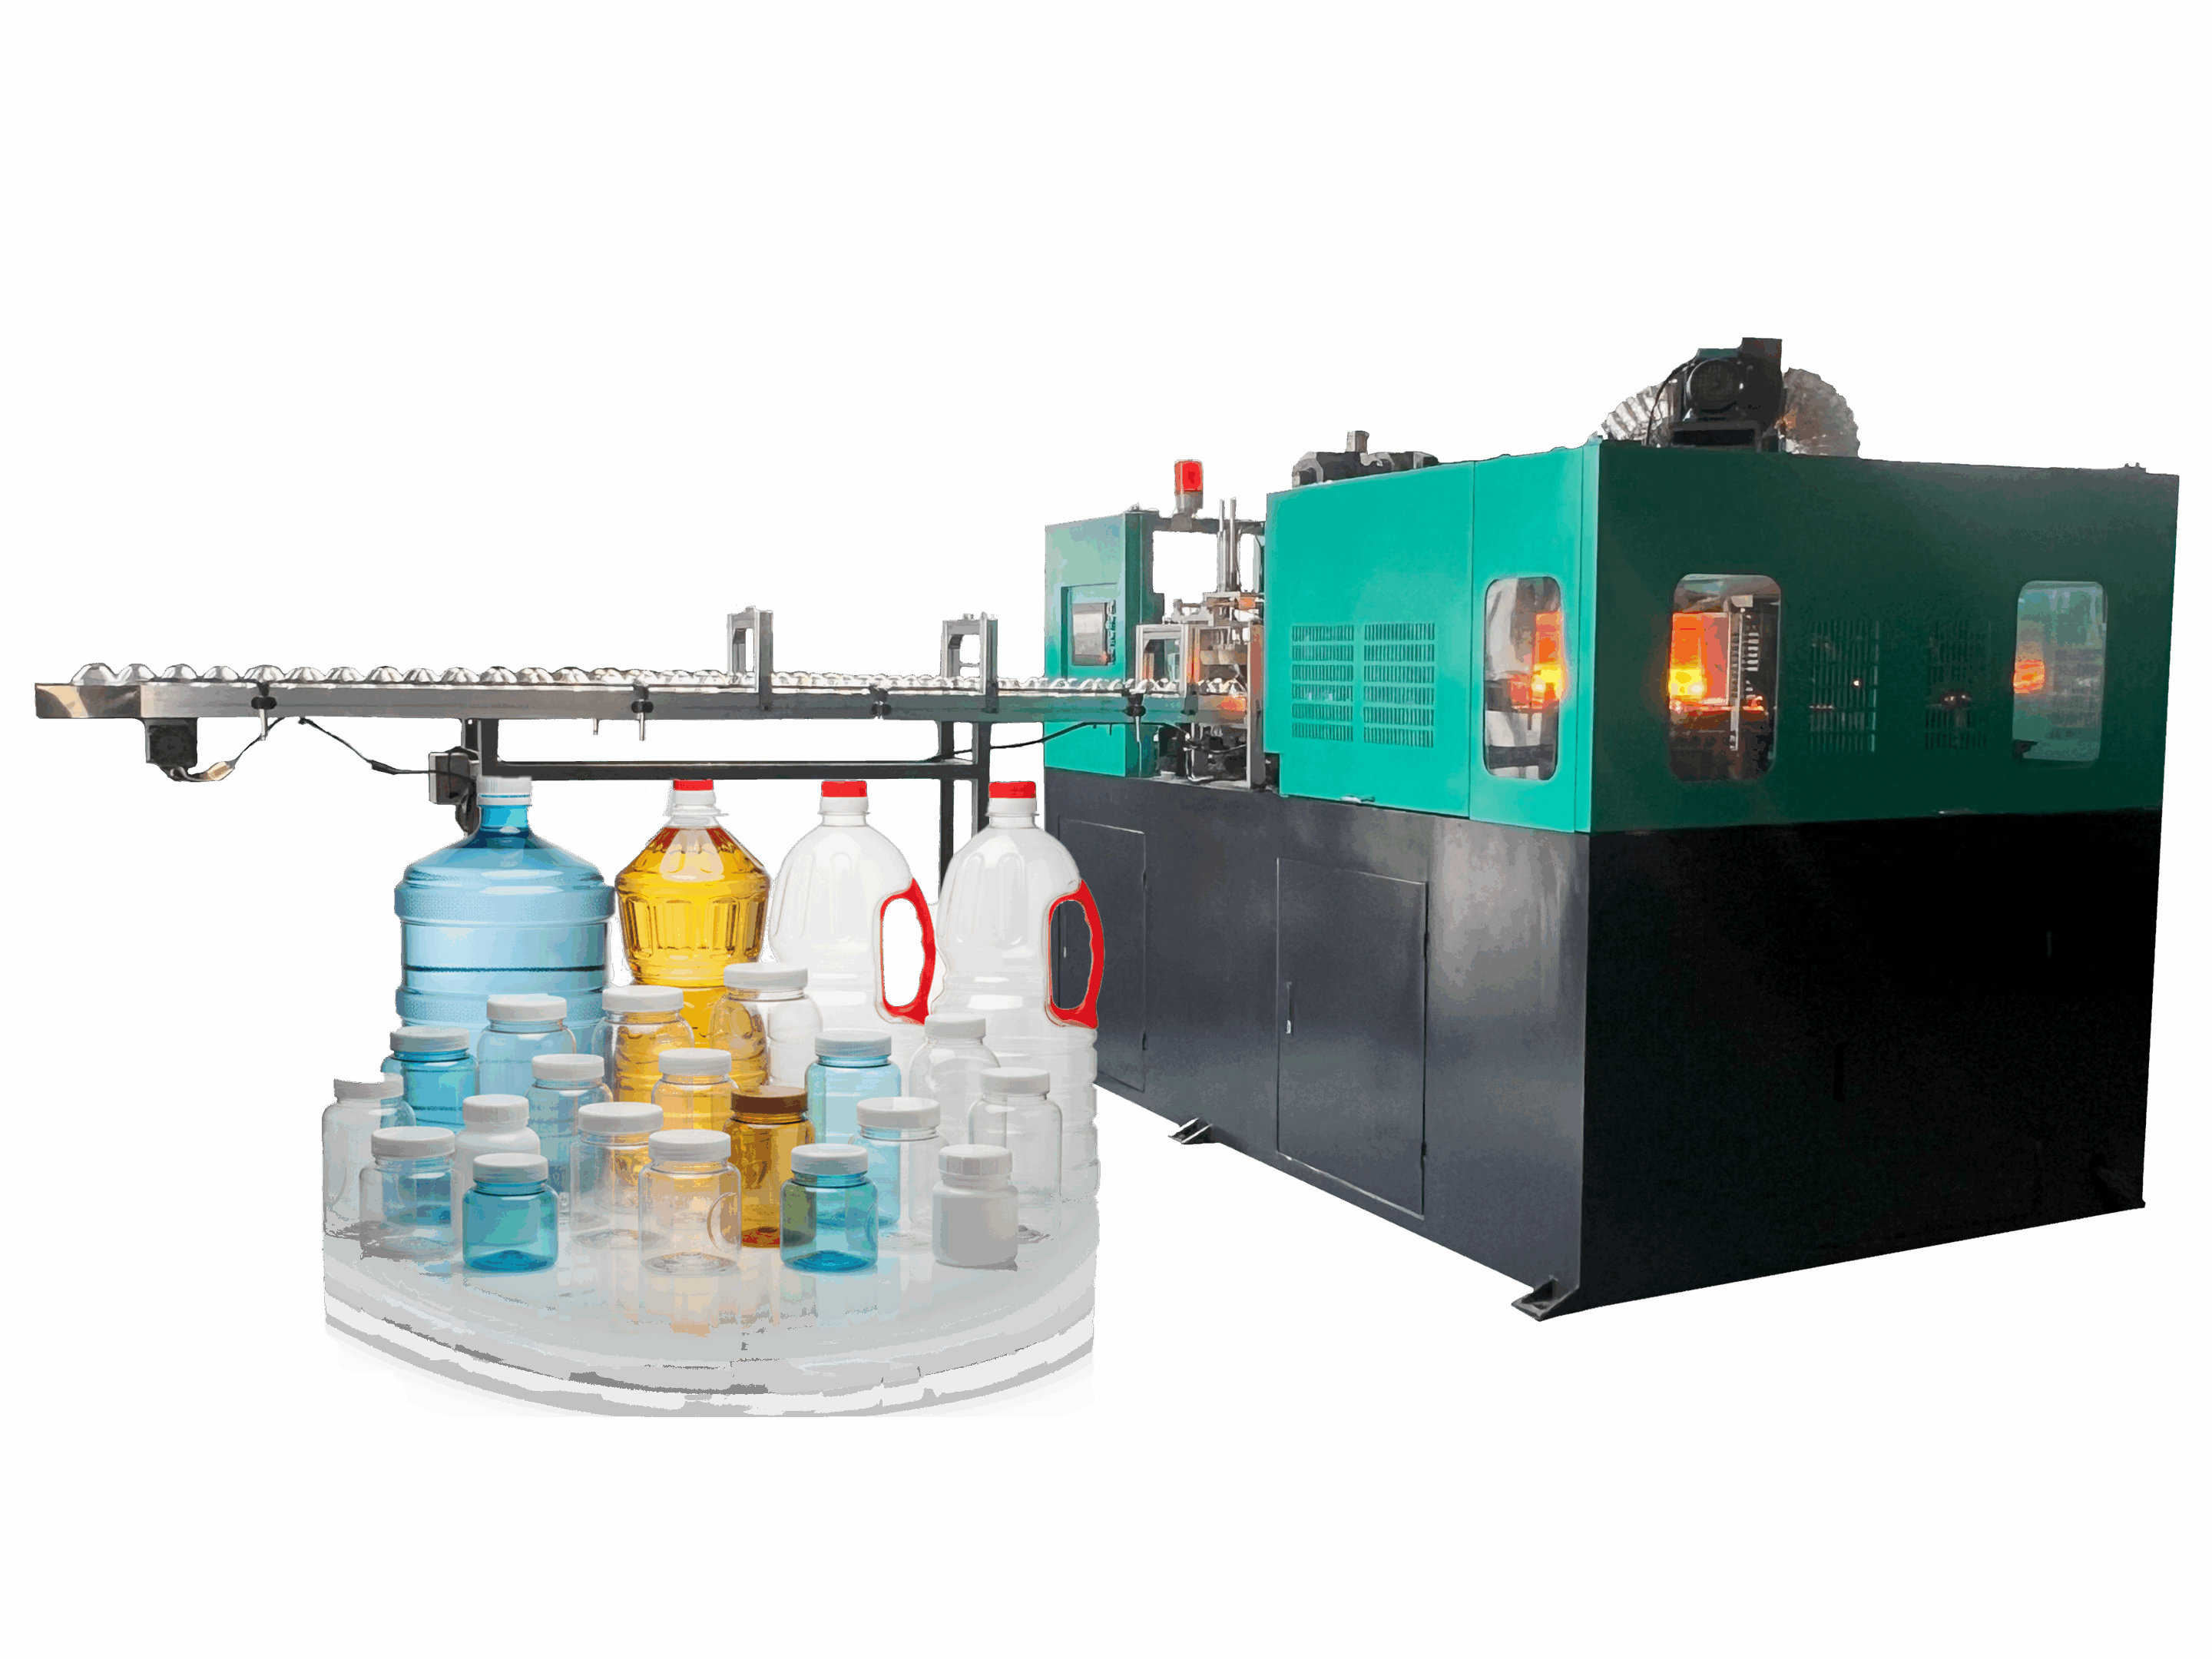
¿Cómo puedo determinar si la capacidad de plastificación de una máquina de moldeo por soplado y extrusión totalmente eléctrica cumple con mis requisitos de producción máxima?
At our facility, we often see clients underestimate capacity, leading to frustrated production teams and missed deadlines. Don’t let a weak extruder stall your growth; here is how to verify the specs.
To determine if capacity meets requirements, multiply your total shot weight (including flash) by cycles per hour, ensuring the result is 15–20% below the screw’s maximum rated kg/hr. Additionally, confirm that screw recovery time is shorter than your cooling phase to prevent cycle delays.
Let’s break down the specific calculations, safety margins, and mechanical verifications you need to check before signing a contract.
How do I calculate if the screw’s kg/hr rating is sufficient for my heaviest bottle and fastest cycle time?
When we size machines for specific projects, we ignore "theoretical" maximums and focus strictly on the math of your specific product. Guesswork here leads to costly deficits later.
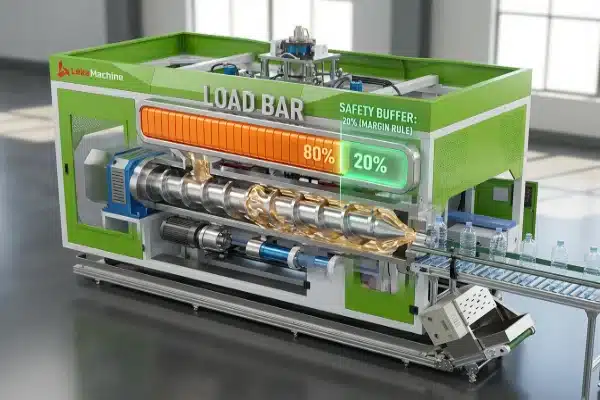
Calculate the required throughput by multiplying the total shot weight of all cavities, including flash, by the number of cycles per hour. Ensure this calculated demand is at least 20% lower than the machine’s rated maximum kg/hr to maintain consistent melt quality and pressure stability.

To accurately size your machine, you must move beyond the basic bottle weight. The extruder does not just process the final product; it must process the entire shot, including the rebaba 1 which is trimmed off later. In our experience, flash can account for 20% to 40% of the total material usage depending on the container handle design.
The Core Calculation Formula
You can determine your Required Plasticizing Rate (RPR) using the following logical steps. This formula gives you the raw data needed to challenge a supplier’s spec sheet.
- Total Shot Weight: (Net Bottle Weight + Flash Weight) × Number of Cavities.
- Cycles Per Hour: 3600 seconds ÷ Total Cycle Time (in seconds).
- Required Rate: Total Shot Weight (kg) × Cycles Per Hour.
For example, if you are running a 4-cavity mold producing a 100g bottle with 30g of flash on a 15-second cycle, your extruder must handle:
(0.13 kg × 4 cavities) × (3600 / 15) = 124.8 kg/hr.
Screw Diameter and L/D Ratio Considerations
Once you have your RPR, you need to match it to the screw hardware. Standard all-electric machines typically feature L/D (Length to Diameter) ratios 2 of 24:1 or 30:1. We generally recommend a 30:1 ratio for high-speed production. This longer screw ensures a more homogeneous melt and consistent pressure, which is critical when running at the upper limits of the machine’s capacity. A shorter 24:1 screw might achieve the output but could sacrifice melt quality, leading to streaks or weak points in the bottle.
Plasticizing Capacity Reference Table
Use this table as a baseline when comparing your calculation against standard machine offerings.
| Screw Diameter (mm) | Typical L/D Ratio | Max Output (kg/h) | Best For Target Output (kg/h) |
|---|---|---|---|
| 60mm | 24:1 | 75 – 90 | < 65 |
| 70mm | 25:1 | 100 – 120 | < 85 |
| 80mm | 30:1 | 140 – 160 | < 120 |
| 90mm | 30:1 | 190 – 210 | < 160 |
| 100mm | 30:1 | 240 – 280 | < 200 |
Note: These figures are general estimates for HDPE. Values will vary based on screw geometry and motor power.
What safety margin should I subtract from the theoretical max output to account for real-world conditions?
We always advise our partners that lab results differ significantly from factory floors. Relying on 100% of the spec sheet usually results in overheating and inconsistent parisons.
Subtract a safety margin of 15–20% from the theoretical maximum output to account for real-world variables like ambient temperature, regrind usage, and bulk density 3 fluctuations. This buffer ensures the extruder operates efficiently without overheating the motor or degrading the polymer through excessive shear.

When a specification sheet states "Max Output: 150 kg/hr," this is often tested under perfect conditions using virgin material with ideal bulk density. In a real factory environment, you are dealing with variables that reduce this efficiency.
Factors Reducing Effective Capacity
You must account for the "Real-World Efficiency" gap. If you run an extruder at 100% capacity continuously, you will likely encounter shear heat issues, where the friction of the screw adds uncontrolled shear heat 4 to the plastic. This degrades the material and ruins the bottle’s structural integrity.
- Regrind Usage: Using Post-Consumer Recycled (PCR) 5 material or in-house regrind changes the bulk density of the feed. Flake material does not feed as efficiently as pellets, often reducing output by 5-10%.
- Material Density: Specification sheets are usually based on HDPE. If you run PP (polipropileno) 6, which is less dense, your output in kg/hr will drop because the screw moves the same volume, but that volume weighs less.
- Wear and Tear: Over time, the gap between the screw flight and the barrel wall increases. A 15% safety margin ensures that even after a year of wear, your machine can still hit production targets.
Assessing Melt Pressure Stability
A clear indicator that you have used up your safety margin is melt pressure instability. During a 4-hour continuous run, we monitor the pressure at the die head.
- Stable: Fluctuations < 1%. The machine is within its comfort zone.
- Unstable: Fluctuations > 1%. The plasticizing unit is struggling.
If the pressure spikes or drops, the tubular 7 length will vary, causing bottles to be either too short (incomplete) or too long (wasteful).
Safety Margin Recommendation Checklist
| Variable | Recommended Deduction from Max Spec |
|---|---|
| Running 100% Virgin Pellets | -15% |
| Running >30% Regrind/Flake | -20% |
| Running PCR (Post-Consumer) | -25% |
| High Altitude / Hot Climate | -5% (Additional) |
Does the all-electric motor provide consistent torque at low speeds for sensitive materials?
In our testing facility, we prioritize torque consistency because stalling at low RPM ruins sensitive resins. A weak motor cannot handle high-viscosity materials effectively.
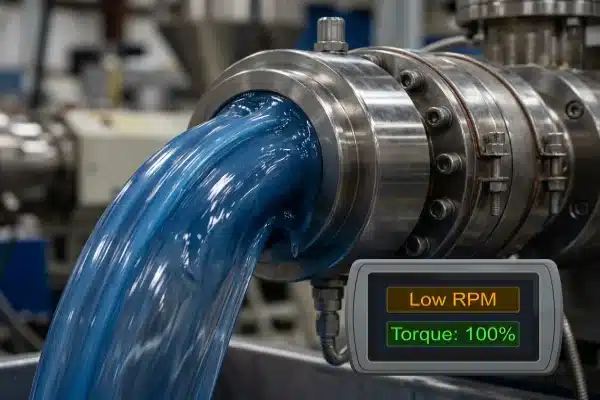
Yes, high-quality all-electric motors provide 100% rated torque even at low RPMs, which is critical for processing high-viscosity or heat-sensitive materials. You must verify the motor’s torque-to-speed curve to ensure it operates in the "sweet spot" without stalling or causing material degradation during slow extrusion.
One of the greatest fears for a manufacturer switching from hydraulic to electric is the perceived loss of "power." However, modern servomotores 8 behave differently. The critical metric here is the torque-to-speed curve.
The Importance of Low-Speed Torque
For certain applications, such as running heavy HMW-HDPE 9 for large drums or processing heat-sensitive engineering plastics, you cannot run the screw at high speeds. High speeds generate shear heat, which burns the material. You must run slowly.
If the motor depends on momentum or high RPM to generate torque (like a standard AC motor), it will stall or surge at low speeds. An all-electric servo system, however, should deliver flat torque response. This means whether the screw is turning at 5 RPM or 50 RPM, the pushing power remains constant.
Requesting the "Sweet Spot" Data
When talking to us or any supplier, ask for the Specific Throughput data. This measures kg/hr per RPM. By comparing this across different speeds, you can identify the efficiency "sweet spot."
- Residency Time Distribution (RTD): At maximum output, does the material stay in the barrel long enough to melt completely?
- Shear Rate: At the required output, is the motor spinning so fast that it shears the polymer chains?
Specific Energy Consumption (SEC)
Another way to verify the motor’s capability is to assess the SEC 10, typically measured in kWh/kg. A servo-driven extruder should maintain a consistent SEC curve. If energy consumption spikes disproportionately at low speeds, it indicates the motor is struggling to overcome the material’s viscosity.
Comparison: Electric vs. Hydraulic Torque
| Característica | All-Electric Servo Motor | Traditional Hydraulic Motor |
|---|---|---|
| Low Speed Torque | Constant (100% available from 0 RPM) | Variable (Drops at low RPM) |
| Speed Consistency | Precise (< 0.1 RPM fluctuation) | Fluctuates with oil temp |
| Eficiencia energética | High (Only uses power when moving) | Low (Pump idles constantly) |
| Overload Capacity | High (Can surge for startup) | Limited by relief valves |
How can I verify the recovery time matches my cooling time to avoid cycle delays?
We configure our controllers to maximize efficiency, but if the screw is too slow, the mold waits. This "dead time" kills your profit margins instantly.
Verify that the screw recovery time—the duration required to extrude the next parison—is at least 1 to 2 seconds shorter than your mold’s cooling time. If plasticizing takes longer than cooling, the extruder becomes the bottleneck, forcing the cycle to extend and reducing overall daily output.

Even if the machine can physically melt 200kg of plastic per hour, it is useless if it cannot get the plastic ready in time for the next cycle. This is the synchronization challenge.
The "Recovery Time" Bottleneck
In a blow molding cycle, the longest phase is usually the cooling time (when the plastic hardens in the mold). During this time, the extruder should be working in the background to prepare (recover) the parison for the next shot.
If your cooling time is 10 seconds, but the extruder needs 12 seconds to melt the required plastic, your cycle time is forced to extend by 2 seconds. Over a 24-hour shift, a 2-second delay per cycle can cost you thousands of bottles in lost production.
The Advantage of All-Electric Overlap
In all-electric machines, we utilize the ability to "overlap" functions. Unlike some hydraulic systems that share pump pressure (meaning you can’t clamp and extrude simultaneously without a huge accumulator), electric axes operate independently.
You should check the synchronization between parison extrusion speed and clamping movement. The ability to begin plasticizing immediately after the previous parison is cut—without waiting for the mold to fully close or lock—can effectively increase your usable capacity by 5-10%.
Verification Step: The 2-Second Rule
To ensure the extruder is never the bottleneck, apply this rule:
- Target: Screw Recovery Time < (Cooling Time – 1.5 seconds).
This buffer allows for slight variations in material feed or voltage without causing the machine to pause and wait for plastic. If the calculated recovery time is exactly equal to the cooling time, you are running at the "Red Line" and will likely experience micro-stops that confuse downstream equipment like leak testers.
Conclusión
To guarantee your production targets, verify that your calculated material demand (including flash) is 20% below the machine’s rated capacity. Ensure the motor delivers constant torque at low speeds and that screw recovery is faster than your cooling cycle. Correct sizing prevents future bottlenecks.
Notas al pie
1. Definition of flash as excess material in manufacturing. ↩︎
2. Explains how screw L/D ratio impacts extrusion. ↩︎
3. Guide to bulk density in plastics processing. ↩︎
4. How shear energy melts polymer in extruders. ↩︎
5. Certification and definition of PCR plastics. ↩︎
6. Chemical properties and density of polypropylene. ↩︎
7. Definition of parison in blow molding context. ↩︎
8. Technical overview of servo motor mechanisms. ↩︎
9. Properties and applications of high-density polyethylene. ↩︎
10. Calculation method for specific energy in extrusion. ↩︎


0 Comentarios